🚦 Execution Monitor Interface
The Execution Monitor provides a detailed view of method executions, tracking their status from the moment they are initiated until completion.
It is divided into two sections:
Live Executions: for current and recently finished jobs
Archived Executions: for saved and reproducible past runs
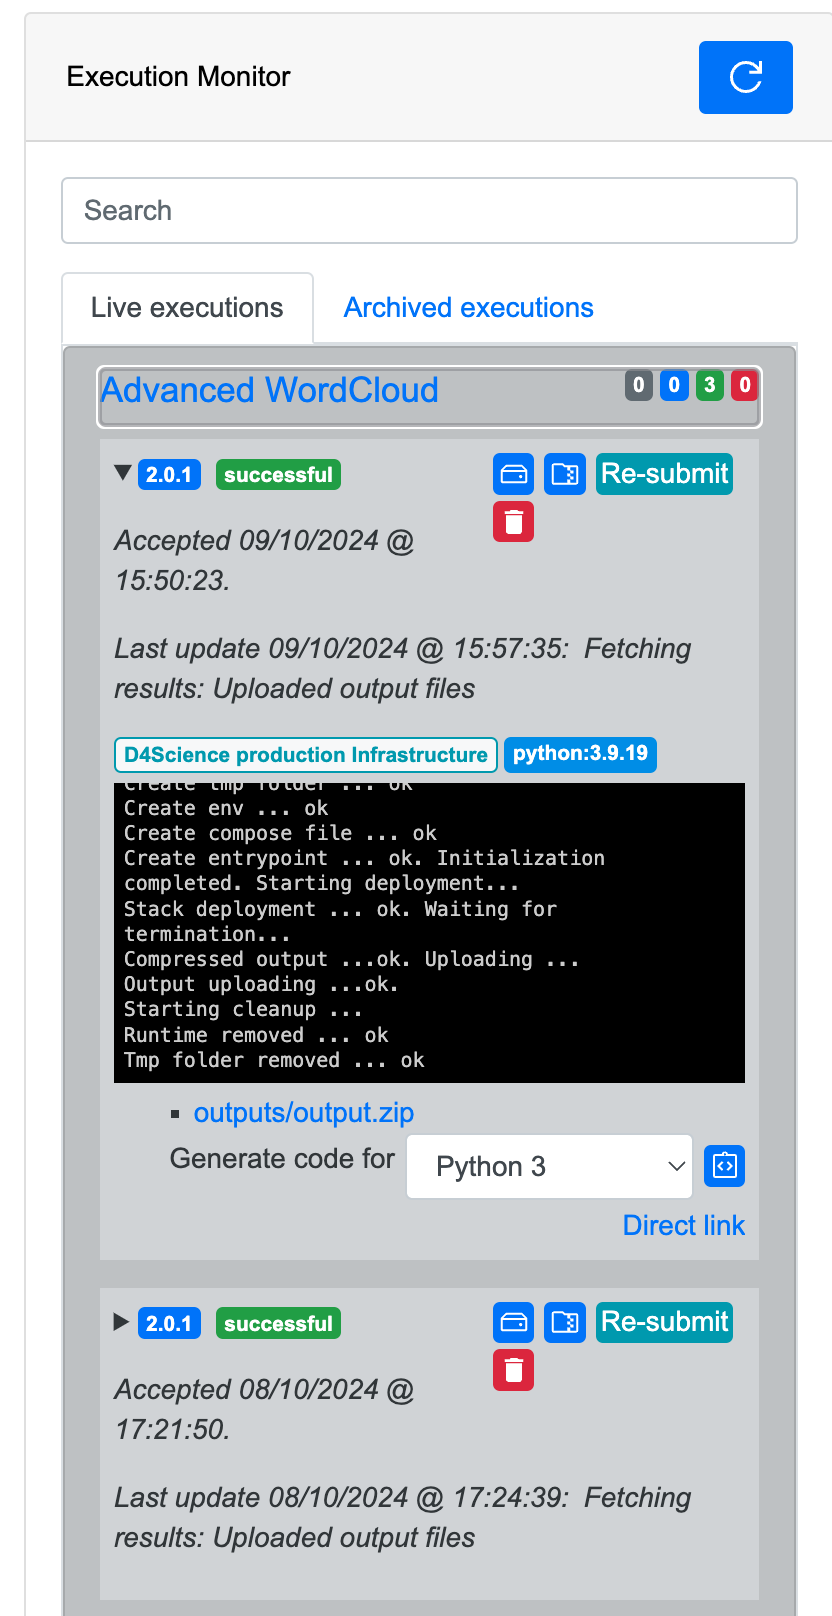
🟢 Live Executions
This view displays the current or recent executions within the environment.
Each entry includes:
Method name and version
Execution status, which may be:
Accepted: waiting in the queue
Running: currently executing
Successful: completed successfully
Failed: execution encountered an error
Timestamps: submission and last update time
Infrastructure: where the method was executed
Runtime: the Docker image used (e.g.,
python:3.9.19)
🔧 Actions Available
Each execution panel includes tools and links:
Outputs: download
output.zipwith all generated filesGenerate code: create an executable script in Python, R, Bash, etc.
Direct link: open the CCP interface at the exact execution
Logs: inspect real-time
stdoutandstderrCancel execution: stop the job (if still running)
Re-submit: rerun with the same parameters
Delete: remove the execution from your history
📦 Archived Executions
When a job is archived (via the live panel), it appears in the Archived Executions view.
This section stores past executions and their complete context, including:
Parameters
Runtime environment
Output files
Metadata and logs
Archived executions are preserved for reproducibility and can be downloaded or shared.